The BB application has a number of screens, which are explained in more detail below.
Portfolio
This is the main screen, where you’ll see a table with key data about your portfolio and each of its coins. It shows the current distribution in and the target distribution in the table (5) and the current distribution in the pie chart (6) as well.

If the relative delta between the current and target distribution exceeds the configured threshold, the last column will show a red ‘sell’ or a green ‘buy’ indicator. If you’re using BB in manual mode, you can select a row in the table and then confirm that BB should execute an order. BB will then automatically buy or sell the appropriate amount to get the coin back in balance. If you’re running BB in automatic mode, orders will be placed without the need for manual actions.
If the amount in the trade column has an orange background, the order cannot be executed according to the exchange’s trading rules, as also indicated by the orange text at the bottom (7). Either the order size or the trade amount is too small. For instance, in the example above, the 0.06 AVAX that should be sold to restore the balance cannot be executed. In this case, the used exchange is Binance, and Binance requires a minimum trade amount of 0.01 AVAX, but also a minimum order size of 5 USDT. At the price of 31.90 USDT, the order size would be 1.914 USDT, which is too small to accept the order. That’s why BB doesn’t place the order. It will wait until the AVAX price goes up further, until the order size is above 5 USDT, and then it will automatically place the order. So there is no need to intervene if you see orange trade amounts. But if you do want to avoid this, you may want to consider increasing your balancing budget.
If you’re using a positive coin offset (e.g. to include coins in cold storage in your balancing portfolio), you may not have enough coins in your spot account to execute an order, which is another reason for the trade amount to get an orange background.
This screen also shows some key performance indicators at the top:
- (1) The value of your portfolio expressed in the set base coin and the change compared to the starting balance, and the fiat value of your portfolio in EUR or USD (depending on the toggle in the lower left corner) and the change compared to the starting balance
- (2) The net effect expressed in the set base coin and the selected fiat value (EUR/USD) and as a percentage. These values are a measure of the balancing effect, by comparing the value of your portfolio with what it would have been if you wouldn’t have done any balancing, but just kept your coins in place after the initial purchase. And the net effect, in EUR or USD, and as a percentage
- (3) The profit & loss, again expressed in the set base coin and the selected fiat value (EUR/USD) and as a percentage. To learn how the PnL is calculated, see this explanation
Hopefully, you’ll be seeing positive numbers here 😉
Note: to keep your performance indicators accurate, make sure you register liquidity changes when you add/remove coins, so BB can normalize the performance. For more information about normalization and logging liquidity changes, see here.
Finally, in the top-right, you’ll see the server status (connected) and when the portfolio data was last updated, as well as the bot’s starting data and for how many days it’s been running (4).
Performance
On this screen, you’ll find four graphs showing how the key performance indicators, as explained above, evolved over time.

Note that with this particular portfolio, the net effect is going down as the prices of the altcoins go up. The reason for that is that in this case a significant part of the portfolio consists of USDT. So whenever altcoin prices go up, some of the altcoins are sold for USDT. As prices rise further, there are fewer altcoins that contribute to the overall portfolio value compared to a scenario without rebalancing (i.e. if the altcoins would simply be hodled). Still, this could be a useful approach, if you want to take profits when prices go up.
At the same time, the profit & loss clearly shows the positive effect of rebalancing. Through small trades, the bot is making small profits, benefitting from the price volatility.
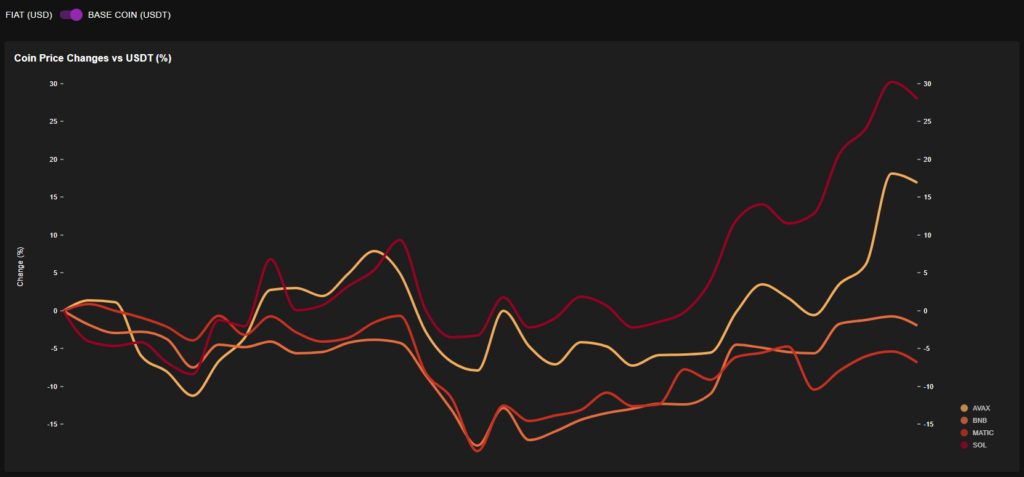
Coin Analysis
This screen shows a graph with the relative price change of the coins in your portfolio since the start date. This gives a quick insight into which coins are your winners, and which are your underperformers.
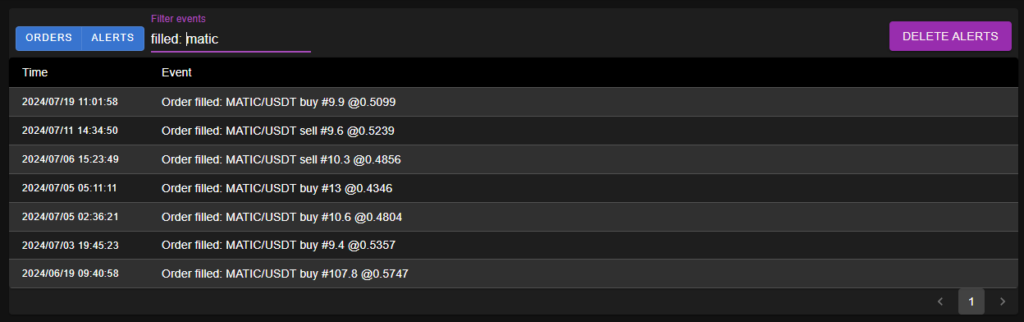
Event History
All orders are logged by BB, and in the table on this screen, you can go back in time and go through the order history.

Possible errors and other system alerts are included here as well. Those can be removed from the event history using the ‘Delete Alerts’ button.
Using the two buttons on the left above the table, you can control which events are shown: orders and/or alerts. The ‘filter events’ can be used to show events that contain specific text. For instance, as in the example below, by typing ‘filled: MATIC’, all filled MATIC orders are shown.